Recently, I found myself in a perplexing situation where the code I had meticulously crafted
behaved differently across development (dev), user acceptance testing (UAT), and production
(prod) environments. Everything was working fine in dev and UAT, but in prod, the code acted
differently for very few specific cases. Despite the similarity in the code, subtle
variations in the environment caused unexpected deviations in behavior. It was a wake-up
call for me as an engineer to learn the importance of monitoring and auditing and how to do
it to suit the project development. That highlighted the importance of implementing robust
monitoring, auditing, and incident response mechanisms across the software development
lifecycle.
Monitoring and auditing are critical components of maintaining the integrity, security,
and performance of any system. In this blog, I will share my insights on how we can delve into best practices
for monitoring and auditing, centralized logging, reducing blast radius at the code level,
preparing responses in case of failure, and conducting root cause analysis.
Monitoring and Auditing
In my recent experience, I encountered the necessity for robust monitoring and auditing mechanisms,
particularly concerning API calls and database transactions within a large system. While AWS CloudWatch provided logging capabilities, it lacked a perfect mechanism for tracking individual
user requests. To address this gap, I implemented the use of unique UUIDs for each API request,
allowing for more granular tracking of code execution and user interactions.
Implement Unique Identifiers (UUIDs) for API Requests
- Assign a unique UUID to each API request at the entry point of the system.
- Include this UUID in all logs generated during the processing of the request.
- Keep these logs in a structured format such as JSON for easier understanding and processing.
- This allows for easy correlation of logs across different components of the system, aiding in troubleshooting and auditing.
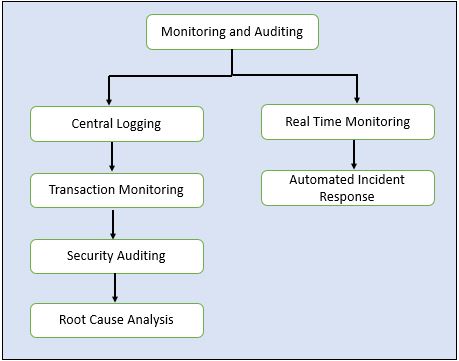
Here what I learned during the process
1. Centralized Logging
- Set up a centralized logging system to aggregate logs from all components of the system, including API endpoints and database transactions.
- Utilize tools such as AWS CloudWatch Logs, ELK Stack (Elasticsearch, Logstash, Kibana), or similar solutions to centralize log storage and analysis.
2. Real-time Monitoring
Implementing real-time monitoring of API calls and database transactions is crucial for promptly detecting anomalies and performance issues in large applications, especially when anomalies occur sporadically.
- Comprehensive Metrics: Establish a set of comprehensive metrics to monitor API calls and database transactions in real-time. These metrics should include response times, error rates, throughput, and database query execution times. Ensure that the selected metrics align with the performance goals and key performance indicators (KPIs) of the system.
- Utilize Monitoring Tools: Employ monitoring tools that offer real-time monitoring capabilities, such as Prometheus, Grafana, or AWS CloudWatch Metrics. Configure these tools to collect and display the defined metrics in real-time dashboards for immediate visibility.
- Set Thresholds and Alerts: Define thresholds for each monitored metric based on acceptable performance ranges and service level agreements (SLAs). Configure alerts to trigger when metrics exceed or fall below the predefined thresholds. These alerts should be sent via email, SMS, or integrated with incident management systems like PagerDuty or OpsGenie.
- Automate Response Actions: Implement automated response actions for critical alerts to minimize response time and mitigate potential issues. For example, automatically scaling resources, restarting services, or routing traffic away from affected components can help maintain system stability in real-time.
- Monitor Resource Utilization: Monitor resource utilization metrics such as CPU usage, memory consumption, and disk I/O to ensure optimal performance and prevent resource bottlenecks. Identify trends and patterns in resource utilization to proactively address potential scalability or capacity issues before they impact system performance.
- Continuous Performance Optimization: Continuously analyze real-time monitoring data to identify opportunities for performance optimization. Adjust thresholds and alerting configurations based on evolving system requirements and performance trends to ensure timely detection and response to anomalies.
- Regular Review and Improvement: Conduct regular reviews of real-time monitoring configurations, metrics, and alerting thresholds to ensure their effectiveness. Solicit feedback from operations teams and stakeholders to identify areas for improvement and optimization in the real-time monitoring process.
3. Database Transaction Monitoring
In the realm of database transaction monitoring, ensuring optimal performance and reliability is paramount. Here's how to effectively monitor and manage your database transactions:
- Bottlenecks Detection: Monitor database transactions closely to detect any signs of performance bottlenecks that could hinder the overall system performance. Identify queries or transactions that are consuming excessive resources, such as CPU or memory, and investigate the root causes behind these bottlenecks.
- Long-Running Queries Identification: Keep a vigilant eye on the duration of database queries and transactions. Identify any queries that are running for an unusually long time, as these could indicate inefficient database indexing, poor query optimization, or resource contention.
- Deadlock Situations Prevention: Implement monitoring mechanisms to detect and prevent deadlock situations in the database. Monitor for locks and contention issues within the database environment, identifying potential deadlock scenarios before they escalate and impact system availability.
- Utilization of Database Monitoring Tools: Employ specialized database monitoring tools, such as Oracle Enterprise Manager, SQL Server Management Studio, or MySQL Enterprise Monitor, to track database performance metrics and transaction throughput. Leverage the features provided by these tools to gain insights into database health, query execution times, and resource utilization patterns.
- Built-in Database Performance Monitoring Features: Utilize built-in performance monitoring features offered by database management systems (DBMS), such as PostgreSQL pg_stat_statements, MySQL Performance Schema, or SQL Server Dynamic Management Views (DMVs). These features provide valuable insights into database performance metrics, query execution plans, and resource usage at a granular level, facilitating proactive optimization efforts.
- Transaction Throughput Tracking: Track transaction throughput metrics to assess the overall workload on the database system. Analyze trends in transaction throughput over time to identify peak usage periods, anticipate capacity requirements, and optimize database resources accordingly.
- Optimization Opportunities Identification: Use the data collected from database transaction monitoring to identify optimization opportunities. Optimize database schema design, query execution plans, and indexing strategies based on performance insights gained from transaction monitoring data.
Regularly review and refine monitoring configurations, thresholds, and alerting mechanisms to adapt to changing workload patterns and performance requirements.
4. Security Auditing
security auditing is paramount to safeguarding sensitive data and protecting against potential threats.
- Comprehensive Auditing Mechanisms: Implement a comprehensive set of auditing mechanisms to monitor all aspects of system activity, including user authentication, access control, data manipulation, and configuration changes. Ensure that auditing mechanisms are capable of capturing both successful and failed security events to provide a complete audit trail for analysis and investigation.
- Unauthorized Access Detection: Monitor for unauthorized access attempts to the system, including login failures, brute force attacks, and suspicious login patterns. Implement real-time alerting mechanisms to notify security personnel of any potential unauthorized access attempts, allowing for immediate response and mitigation.
- Abnormal User Behavior Monitoring: Utilize behavioral analysis techniques to identify abnormal user behavior patterns indicative of potential security threats. Monitor for deviations from typical user activity, such as unusual login times, access to unauthorized resources, or excessive data downloads, and investigate further as necessary.
- Security Breach Detection: Implement proactive measures to detect and respond to potential security breaches in real-time. Monitor for indicators of compromise (IOCs) such as unusual network traffic, unauthorized file modifications, or unexpected system changes, and take immediate action to contain and mitigate the breach.
- Utilization of Monitoring Tools: Leverage specialized security monitoring tools and platforms to streamline the auditing process and enhance threat detection capabilities. Utilize tools such as AWS CloudTrail to track API usage and AWS Config for monitoring compliance with security policies, providing visibility into user activity and configuration changes across your AWS environment.
- Log Analysis and Correlation: Analyze audit logs generated by security monitoring tools to identify potential security incidents and anomalies. Correlate information from multiple sources, including system logs, network traffic data, and user activity logs, to gain a comprehensive understanding of security events and their impact on the system.
- Continuous Improvement and Compliance: Regularly review and update security auditing mechanisms to adapt to evolving threats and compliance requirements. Conduct periodic audits of security controls and practices to ensure compliance with industry standards and regulations, such as GDPR, HIPAA, or PCI DSS.
5. Automated Incident Response
The ability to respond swiftly to critical issues is crucial for maintaining the availability and reliability of systems.
- Identification of Critical Issues: Define a set of criteria for identifying critical issues that warrant automated incident response. These criteria may include predefined thresholds for performance metrics, severity levels of security events, or specific error codes indicating system failures.
- Automation Tool Selection: Choose appropriate automation tools and platforms capable of integrating with your existing monitoring and alerting systems. Consider tools such as Ansible, Puppet, or AWS Systems Manager Automation to automate incident response tasks and workflows.
- Workflow Automation: Develop automated workflows to address common issues and scenarios encountered in your environment. Define step-by-step procedures for incident response actions, including diagnostic checks, remediation tasks, and escalation procedures.
- Incident Response Playbooks: Create incident response playbooks outlining predefined actions and responses for various types of incidents. Include detailed instructions for automated response tasks, along with escalation procedures and contact information for key personnel.
- Alert Integration: Integrate automated incident response mechanisms with your existing monitoring and alerting systems. Configure alerting rules to trigger automated responses based on predefined criteria, such as the severity level of an alert or the occurrence of specific events.
- Escalation Procedures: Define escalation procedures for incidents that cannot be resolved automatically or require human intervention. Establish clear communication channels and escalation paths to ensure that critical issues are promptly escalated to the appropriate personnel for resolution.
- Automated Remediation Actions: Implement automated remediation actions for common issues to minimize downtime and mitigate potential impact on users. Examples of automated remediation actions may include restarting failed services, scaling resources to handle increased demand, or applying configuration changes to resolve known issues.
- Testing and Validation: Thoroughly test and validate automated incident response workflows and playbooks in a controlled environment before deploying them in production. Conduct regular exercises and simulations to ensure that automated response mechanisms are effective and reliable in real-world scenarios.
- Continuous Improvement: Continuously review and refine automated incident response mechanisms based on feedback and lessons learned from incident response activities. Identify opportunities for optimization and enhancement to further streamline incident response processes and improve overall system resilience.
By implementing automated incident response mechanisms, as an engineer you can effectively respond to critical issues in real-time, minimize downtime, and mitigate potential impact on users, thereby enhancing the reliability and availability of the systems.
6. Root Cause Analysis
Conducting thorough root cause analysis is essential for understanding the underlying factors contributing to incidents or performance issues detected during monitoring.
- Incident Documentation: Begin by documenting the details of the incident, including the symptoms observed, the impact on users or systems, and any initial actions taken to address the issue. Capture relevant information such as timestamps, error messages, and affected components to provide context for the analysis.
- Gather Data: Collect all available data related to the incident, including log files, performance metrics, configuration settings, and system health reports. Utilize monitoring tools and logging systems to extract relevant data points that may help in identifying the root cause of the issue.
- Timeline Analysis: Create a timeline of events leading up to and following the incident, detailing each step taken and any changes or anomalies observed. Analyze the sequence of events to identify potential triggers or contributing factors that may have led to the incident.
- Investigation and Analysis: Review the gathered data and analyze it systematically to identify patterns, trends, and correlations. Look for anomalies or deviations from normal behavior that could indicate the presence of a root cause, such as sudden spikes in resource utilization or recurring error messages.
- Hypothesis Generation: Generate hypotheses or theories about the possible root causes of the incident based on the analysis of available data. Consider factors such as software bugs, misconfigurations, environmental changes, or human errors as potential contributing factors.
- Testing and Validation: Conduct experiments or tests to validate each hypothesis and determine whether it accurately explains the observed behavior. Utilize tools such as debugging utilities, performance profiling tools, or test environments to simulate conditions and verify the impact of potential root causes.
- Resolution and Preventive Measures: Once the root cause has been identified and validated, develop and implement corrective actions to address the issue and prevent recurrence. This may involve applying software patches or updates, adjusting configuration settings, revising deployment procedures, or providing additional training or documentation to personnel.
- Documentation and Knowledge Sharing: Document the findings of the root cause analysis process, including the identified root cause, the steps taken to address it, and any preventive measures implemented. Share this information with relevant stakeholders, including development teams, operations staff, and management, to ensure awareness and facilitate learning from the incident.
By conducting thorough root cause analysis, you as an engineer can gain valuable insights into the underlying causes of incidents or performance issues, you can help your team to enabling them to implement effective corrective actions and preventive measures to enhance the reliability and stability of their systems over time.
In conclusion, mastering best practices in monitoring, auditing, and incident response is crucial for ensuring the integrity, security, and performance of software development environments.
Throughout this blog, we've explored strategies for implementing robust monitoring and auditing mechanisms, including real-time monitoring of API calls and database transactions, security auditing, and automated incident response. By adopting these practices, engineers can promptly detect anomalies, mitigate potential issues, and maintain the reliability and availability of their systems. Continuous improvement and adaptation to evolving requirements are essential in this process. Remember, investing in effective monitoring, auditing, and incident response practices is an investment in the stability and success of your software projects.